Car Sales FY 2026-27 (Year to Date): 28,00,329 Units, Up 16.2% YoY
Every car registered in India over FY 2026-27 so far — April 2026 to October 2026. India's financial year runs April to March, the window every listed automaker reports on. Month-by-month volumes, the manufacturer leaderboard, how the segment moved against the rest of the market, and the same window in every earlier year on record.
நேரலை. FY 2026-27 இன்னும் நடந்துகொண்டிருக்கிறது — புதிய பதிவுகள் வெளியிடப்படும்போது இந்தப் பக்கம் வளரும்.
Car sales month by month, FY 2026-27
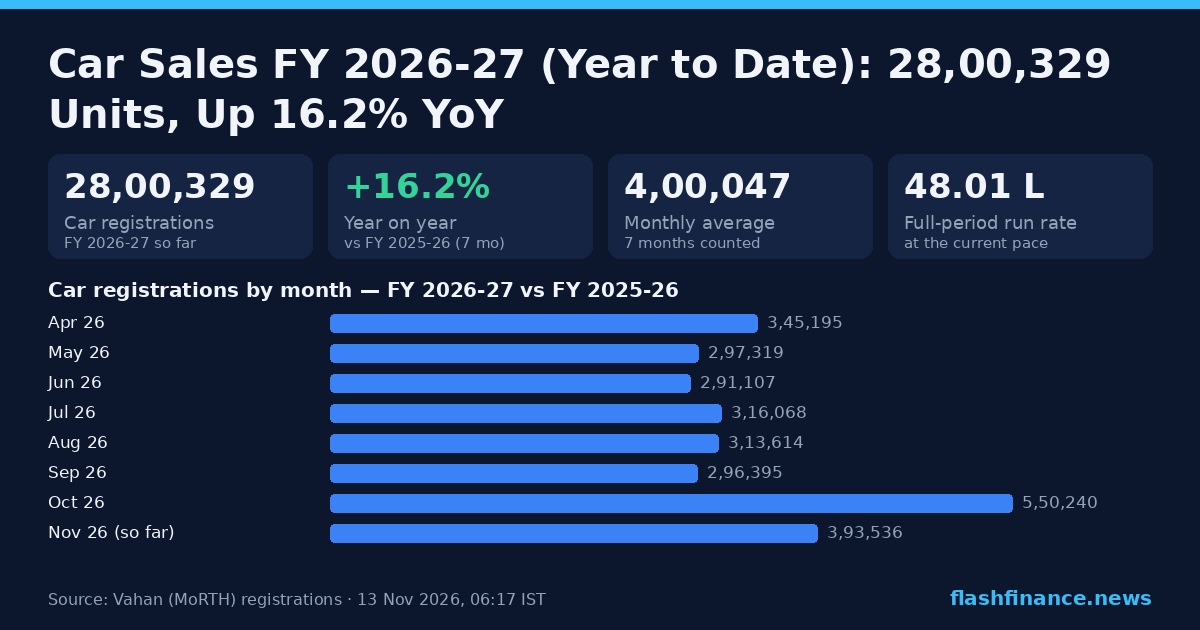
India's passenger car market registered 28,00,329 cars in FY 2026-27 so far. Volumes pushed ahead 16.2% against the 24,09,938 logged over the same 7 months of FY 2025-26.
October was the strongest month of the period at 4,75,174 cars and August the quietest at 3,76,422, an average of 4,00,047 a month. 6 of those 7 months grew on the same month a year earlier.
FY 2026-27 still has 5 months to run. Held at the pace of the 7 months already counted, it would finish near 48.01 L cars — a run rate rather than a forecast, and the festive quarter moves it more than anything else on this page.
Cars accounted for 14.9% of everything registered in India over the period, up from 14.1% in FY 2025-26. The whole market ran to 1,87,89,285 vehicles over the same window, up 10.2% year on year.
These are privately registered cars and UVs. Vahan books taxis and cabs as a class of their own, another 2,64,906 in FY 2026-27 so far, and passenger-vehicle figures published elsewhere usually include them. With taxis, the period stands at 30,65,235 passenger vehicles.
Car registrations by month — FY 2026-27 vs FY 2025-26
Vahan retail registrations, each month set against the same month a year earlier. The lighter bar is November so far, not yet in the FY 2026-27 total.
Every completed month of FY 2026-27, with the matching month of FY 2025-26 beside it.
| மாதம் | FY 2026-27 units | FY 2025-26 units | YoY | காலகட்டத்தின் பங்கு |
|---|---|---|---|---|
| ஏப்ரல் 2026 | 3,92,378 | 3,45,195 | +13.7% | 14.0% |
| மே 2026 | 3,81,436 | 2,97,319 | +28.3% | 13.6% |
| ஜூன் 2026 | 3,85,505 | 2,91,107 | +32.4% | 13.8% |
| ஜூலை 2026 | 3,88,392 | 3,16,068 | +22.9% | 13.9% |
| ஆகஸ்ட் 2026 | 3,76,422 | 3,13,614 | +20.0% | 13.4% |
| செப்டம்பர் 2026 | 4,01,022 | 2,96,395 | +35.3% | 14.3% |
| அக்டோபர் 2026 | 4,75,174 | 5,50,240 | −13.6% | 17.0% |
ஒவ்வொரு மாதமும் அதன் முழு அறிக்கைக்கு இணைக்கப்பட்டுள்ளது.
Which manufacturer sold the most, FY 2026-27
Maruti Suzuki led the period with 10,58,701 registrations, up 18.0% on FY 2025-26. Mahindra follows on 3,44,289, 7,14,412 behind — a gap of 3.08x.
The fastest riser in the top 8 was Tata Motors (EV), up 105.9% to 89,559, while Skoda was down 8.2% at 61,445.
Volumes here are registrations inside the segment only, counted with Vahan's own vehicle-class filter, so each is the manufacturer's car volume over FY 2026-27. Companies that file electric models under a maker of their own appear as separate rows.
Top manufacturers by registrations — FY 2026-27
பிரிவுக்குள் உள்ள பதிவுகள் (கார்கள் மட்டும்).
Exact registrations over April 2026 to October 2026, with the change against FY 2025-26.
| # | உற்பத்தியாளர் | FY 2026-27 units | கார்களின் பங்கு | vs FY 2025-26 |
|---|---|---|---|---|
| 1 | Maruti Suzuki | 10,58,701 | 37.81% | +18.0% |
| 2 | Mahindra | 3,44,289 | 12.30% | +10.0% |
| 3 | Tata Motors (PV) | 3,25,896 | 11.64% | +16.4% |
| 4 | Hyundai | 3,21,862 | 11.50% | +4.7% |
| 5 | Toyota Kirloskar | 1,83,459 | 6.55% | +3.6% |
| 6 | Kia India | 1,83,225 | 6.54% | +19.5% |
| 7 | Tata Motors (EV) | 89,559 | 3.20% | +105.9% |
| 8 | Skoda | 61,445 | 2.19% | −8.2% |
| 9 | Mahindra Electric Automobile | 50,036 | 1.79% | +123.4% |
| 10 | MG Motor | 47,069 | 1.68% | +9.8% |
| 11 | Honda Cars | 36,095 | 1.29% | +8.3% |
| 12 | Renault India | 25,841 | 0.92% | +23.5% |
| 13 | Nissan India | 20,943 | 0.75% | +75.1% |
| 14 | BMW India | 11,962 | 0.43% | +22.4% |
| 15 | Mercedes-Benz | 11,150 | 0.40% | +2.1% |
மற்ற சந்தையுடன் ஒப்பிடும்போது கார் விற்பனை
Set against the rest of the market, cars outgrew the national picture over FY 2026-27: +16.2% against +10.2% for every vehicle registered in India.
இந்த அட்டவணை Vahan அறிக்கை அளிக்கும் ஒவ்வொரு பிரிவையும் ஒரே 7 மாதக் காலத்தில் உள்ளடக்குகிறது; அதனால் ஒப்பீடு நேருக்கு நேர் — இரு பக்கமும் ஒரே மாதங்கள், ஒரே மூலம்.
இந்தியச் சந்தையில் கார் பங்கு, மாதந்தோறும்
அந்த மாதம் பதிவான அனைத்து வாகனங்களிலும் கார்களின் சதவீதம்.
ஏப்ரல் 2026 முதல் அக்டோபர் 2026 வரையிலான பிரிவு வாரியான துல்லியமான வால்யூம்.
| பிரிவு | FY 2026-27 units | பங்கு | vs FY 2025-26 |
|---|---|---|---|
| இருசக்கர வாகனங்கள் | 1,33,87,191 | 71.25% | +7.9% |
| கார்கள் & UVகள் | 28,00,329 | 14.90% | +16.2% |
| மூன்று சக்கர வாகனங்கள் | 8,93,584 | 4.76% | +13.7% |
| டிராக்டர்கள் | 6,28,493 | 3.34% | +18.2% |
| சரக்கு வாகனங்கள் | 6,11,868 | 3.26% | +21.2% |
| டாக்சிகள் & கேப்கள் | 2,64,906 | 1.41% | +26.1% |
| பிற வகைகள் | 1,16,970 | 0.62% | +0.7% |
| பேருந்துகள் | 85,944 | 0.46% | +4.4% |
எந்தெந்த எரிபொருளில் கார்கள் இயங்குகின்றன
Vahan splits a segment by fuel only across a whole calendar year, so this table covers 2026 year to date rather than FY 2026-27 alone — it is exact for that window.
Petrol accounts for 46.1% of car registrations over 2026 year to date, with battery-electric at 6.8%.
எரிபொருள் வாரியான கார் பதிவுகள் — 2026 ஆண்டு இதுவரை
2026 ஆண்டின் இதுவரையிலான கலவை.
| எரிபொருள் | 2026 யூனிட்கள் | பங்கு | முழு ஆண்டு 2025-உடன் ஒப்பீடு |
|---|---|---|---|
| பெட்ரோல் | 19,87,811 | 46.12% | −5.20pp |
| CNG / LPG | 8,48,841 | 19.70% | +2.19pp |
| டீசல் | 7,81,459 | 18.13% | −0.27pp |
| ஹைப்ரிட் | 3,96,197 | 9.19% | +0.84pp |
| மின்சார | 2,94,623 | 6.84% | +2.44pp |
| மற்றவை | 869 | 0.02% | +0.01pp |
Car sales by financial year
Across the 2 completed windows in our Vahan record, car registrations went from 39,71,760 in FY 2024-25 to 44,93,818 in FY 2025-26, up 13.1% over the stretch.
FY 2026-27 is still running — 7 of its 12 months are counted — so it is a part window and is never set against a full one. Its year-on-year figure compares only the months it actually holds.
Car registrations by financial year
* சாளரம் இன்னும் நடைமுறையில் உள்ளது.
| காலம் | மாதங்கள் | யூனிட்கள் | YoY |
|---|---|---|---|
| FY 2026-27 (to date) | 7 | 28,00,329 | +16.2% |
| FY 2025-26 | 12 | 44,93,818 | +13.1% |
| FY 2024-25 | 12 | 39,71,760 | +4.0% |
ஒவ்வொரு வரியும் அந்தச் சாளரத்தில் உள்ள மாதங்களை மட்டுமே ஒப்பிடுகிறது; பகுதி காலம் ஒருபோதும் முழு காலத்துடன் ஒப்பிடப்படாது.
அடிக்கடி கேட்கப்படும் கேள்விகள்
How many cars were sold in India in FY 2026-27?
What period does FY 2026-27 cover?
Which manufacturer sold the most cars in FY 2026-27?
Which was the strongest month for car sales in FY 2026-27?
What share of the Indian market were cars in FY 2026-27?
What will full-year FY 2026-27 car sales be?
Which financial year had the highest car sales?
இவை சில்லறை விற்பனையா அல்லது தொழிற்சாலை அனுப்பல்களா?
கார் விற்பனை, பிற காலங்கள்
அறிக்கைப் பிரிவிலிருந்து மேலும்
மூலம். ஒவ்வொரு எண்ணும் ஒரு வாகன பதிவு; சாலைப் போக்குவரத்து மற்றும் நெடுஞ்சாலைகள் அமைச்சகத்தின் Vahan 4 டாஷ்போர்டிலிருந்து (vahan.parivahan.gov.in) எடுக்கப்பட்டது — சில்லறை தரவுக்கு FADA மற்றும் தொழில்துறை பயன்படுத்தும் அதே மூலம். பதிவுகள் என்பவை உற்பத்தியாளர்கள் ஒவ்வொரு மாதமும் அறிவிக்கும் மொத்த விநியோக எண்ணிக்கைகள் அல்ல. "EV" என்பது பேட்டரி மின்சார வாகனத்தைக் குறிக்கிறது (Vahan எரிபொருள் வகைகள் PURE EV மற்றும் ELECTRIC(BOV)); ஹைப்ரிட்கள் தனியாக எண்ணப்படுகின்றன. தகவலுக்கு மட்டுமே, முதலீட்டு ஆலோசனை அல்ல.
இந்த எண்களைப் பயன்படுத்துகிறீர்களா? “Flash Finance (Vahan data)” என்பதை இந்தப் பக்கத்தின் இணைப்புடன் மேற்கோள் காட்டுங்கள். இந்த அறிக்கையின் சார்ட் கார்டு அதே வரவுடன் மீண்டும் வெளியிட இலவசம்.