Vehicle Tax Collection in India: ₹12,244 crore in October 2026, −5.7% YoY
How much India collects in road tax and vehicle fees through Vahan, month by month, against last year and state by state.
Vehicle tax and fees, October 2026
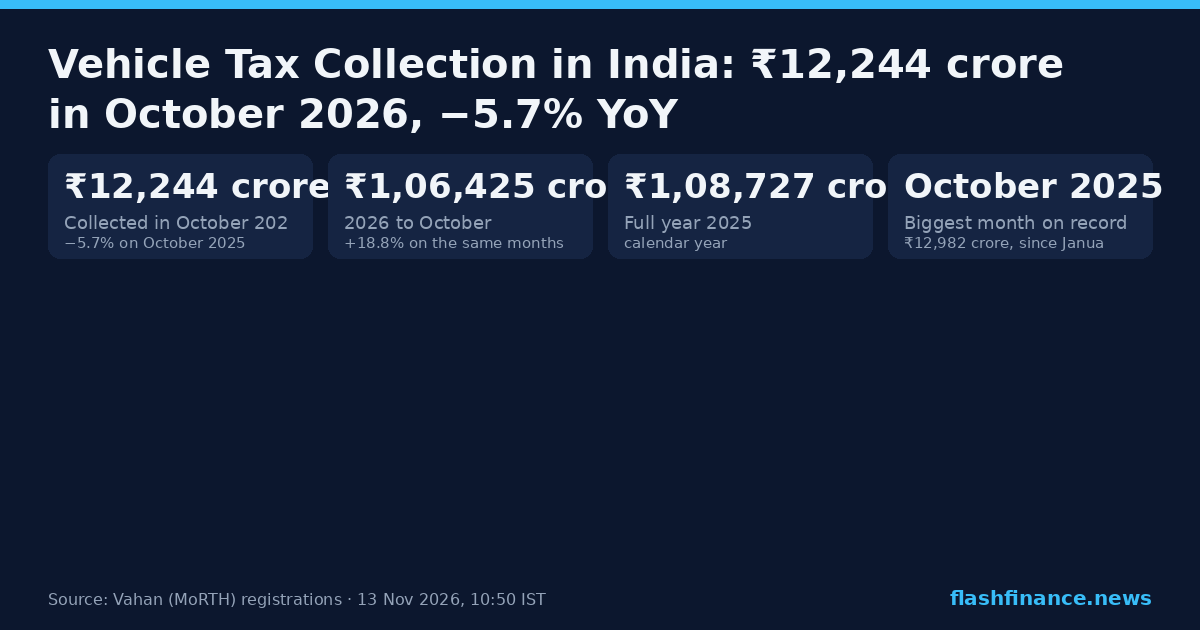
India collected ₹12,244 crore in taxes and fees through Vahan in October 2026, −5.7% on October 2025 and +20.6% on September 2026. From January to October the total is ₹1,06,425 crore, +18.8% on the same months of 2025.
Collections moved faster than registrations: Vahan registered 31,99,765 vehicles in October 2026, −23.3% on a year earlier. Most states charge road tax as a share of a vehicle's price, so the mix of what is bought matters as well as how many.
Vahan is where road tax on new vehicles, registration and ownership-transfer fees, permits and fitness certificates are paid. The figure here is what those services collected, as the Ministry of Road Transport and Highways' Vahan Public Dashboard reports it; the dashboard does not split it by tax or fee, and neither do we.
November 2026 so far: ₹4,349 crore. A running month is not compared with finished ones.
Tax and fees collected through Vahan, ₹ crore a month, 2024–2026
One line per calendar year; the running month is left off.
மாதம் வாரியாக
Each month of 2026 against the same month of 2025, in ₹ crore.
| மாதம் | 2026 | 2025 | மாற்றம் |
|---|---|---|---|
| ஜனவரி | 11,519 | 10,025 | +14.9% |
| பிப்ரவரி | 9,633 | 7,390 | +30.4% |
| மார்ச் | 11,970 | 9,578 | +25.0% |
| ஏப்ரல் | 11,380 | 9,254 | +23.0% |
| மே | 9,584 | 7,960 | +20.4% |
| ஜூன் | 9,640 | 7,574 | +27.3% |
| ஜூலை | 10,541 | 8,730 | +20.7% |
| ஆகஸ்ட் | 9,760 | 8,428 | +15.8% |
| செப்டம்பர் | 10,155 | 7,661 | +32.5% |
| அக்டோபர் | 12,244 | 12,982 | −5.7% |
| நவம்பர் | — | 10,080 | — |
| டிசம்பர் | — | 9,066 | — |
Every state
Maharashtra collected the most in October 2026, ₹1,631 crore, 13.3% of India's total, ahead of Karnataka (₹1,298 crore).
| # | மாநிலம் | அக்டோபர் 2026 | YoY | இந்தியாவின் பங்கு | 2026 to date | YTD YoY |
|---|---|---|---|---|---|---|
| 1 | மகாராஷ்டிரா | 1,631 | −10.6% | 13.3% | 13,405 | +13.3% |
| 2 | கர்நாடகா | 1,298 | −2.4% | 10.6% | 11,706 | +15.6% |
| 3 | உத்தர பிரதேசம் | 1,169 | −11.2% | 9.6% | 10,367 | +23.3% |
| 4 | Tamil Nadu | 923 | −6.3% | 7.5% | 10,347 | +18.2% |
| 5 | தெலங்கானா | 802 | — | 6.6% | 6,009 | +134.3% |
| 6 | குஜராத் | 746 | +14.5% | 6.1% | 5,222 | +18.7% |
| 7 | கேரளா | 668 | −9.9% | 5.5% | 6,527 | +16.0% |
| 8 | ராஜஸ்தான் | 661 | −22.4% | 5.4% | 6,328 | +7.2% |
| 9 | ஆந்திரப் பிரதேசம் | 647 | +8.7% | 5.3% | 4,104 | +18.7% |
| 10 | ஹரியானா | 476 | −12.6% | 3.9% | 4,269 | +9.4% |
| 11 | மத்தியப் பிரதேசம் | 450 | −26.5% | 3.7% | 3,777 | +5.1% |
| 12 | மேற்கு வங்காளம் | 427 | +12.7% | 3.5% | 3,706 | +16.5% |
| 13 | பீகார் | 336 | −29.3% | 2.7% | 3,100 | +13.5% |
| 14 | பஞ்சாப் | 328 | −6.0% | 2.7% | 3,174 | +13.6% |
| 15 | ஒடிசா | 294 | −2.5% | 2.4% | 2,270 | +7.8% |
| 16 | டெல்லி | 284 | −11.4% | 2.3% | 2,615 | +5.9% |
| 17 | சத்தீஸ்கர் | 223 | −23.6% | 1.8% | 1,772 | +3.7% |
| 18 | அசாம் | 208 | +13.8% | 1.7% | 1,625 | +6.0% |
| 19 | ஜார்க்கண்ட் | 187 | −19.1% | 1.5% | 1,636 | +8.4% |
| 20 | உத்தரகண்ட் | 131 | −15.5% | 1.1% | 1,151 | +10.7% |
| 21 | Jammu & Kashmir | 93 | −10.4% | 0.8% | 868 | +17.1% |
| 22 | இமாச்சலப் பிரதேசம் | 70 | −22.7% | 0.6% | 622 | +8.0% |
| 23 | கோவா | 42 | −12.9% | 0.3% | 388 | +4.2% |
| 24 | சண்டிகர் | 31 | +10.0% | 0.3% | 318 | +10.8% |
| 25 | நாகாலாந்து | 29 | +98.3% | 0.2% | 240 | +10.5% |
| 26 | மேகாலயா | 17 | +23.1% | 0.1% | 164 | +37.6% |
| 27 | புதுச்சேரி | 15 | +6.1% | 0.1% | 147 | +24.3% |
| 28 | திரிபுரா | 14 | +25.1% | 0.1% | 117 | +22.5% |
| 29 | UT of DNH and DD | 13 | −11.8% | 0.1% | 152 | +12.5% |
| 30 | அருணாச்சலப் பிரதேசம் | 9 | −3.3% | 0.1% | 93 | +15.1% |
| 31 | மணிப்பூர் | 7 | −9.3% | 0.1% | 62 | +9.7% |
| 32 | சிக்கிம் | 6 | +29.4% | 0.1% | 62 | +25.7% |
| 33 | மிசோரம் | 5 | +18.7% | 0.0% | 43 | +12.7% |
| 34 | லடாக் | 3 | −6.8% | 0.0% | 30 | +6.9% |
| 35 | அந்தமான் & நிக்கோபார் தீவுகள் | 1 | +8.6% | 0.0% | 7 | +16.8% |
| 36 | லட்சத்தீவு | 0 | +124.8% | 0.0% | 1 | +77.7% |
36 states and union territories, 100.00% of India's October 2026 total.
அடிக்கடி கேட்கப்படும் கேள்விகள்
How much vehicle tax did India collect in October 2026?
How much vehicle tax did India collect in 2025?
Which state collects the most vehicle tax?
What does this figure include?
இந்தத் தரவு எங்கிருந்து வருகிறது?
அறிக்கைப் பிரிவிலிருந்து மேலும்
மூலம். ஒவ்வொரு எண்ணும் வாகனங்கள் அல்ல, பணம்: Vahan மூலம் வசூலிக்கப்படும் வரிகள் மற்றும் கட்டணங்கள் (சாலை வரி, பதிவு மற்றும் பரிமாற்றக் கட்டணங்கள், அனுமதிகள், தகுதிச் சான்று மற்றும் அது கையாளும் பிற சேவைகள்), சாலைப் போக்குவரத்து மற்றும் நெடுஞ்சாலைகள் அமைச்சகத்தின் Vahan பொது டாஷ்போர்டு (analytics.parivahan.gov.in) அதன் "Tax & Fee Collection" விளக்கப்படத்தில் காட்டுவது போல. டாஷ்போர்டு ஒரே ஒருங்கிணைந்த எண்ணைத் தருகிறது; அதை நாங்கள் பிரிப்பதில்லை. ஒரு மாநிலம், அதன் பதிவு எண்ணிக்கைகள் அதே டாஷ்போர்டில் Vahan 4 டாஷ்போர்டுடன் பொருந்தினால் மட்டுமே பட்டியலிடப்படும். தகவலுக்கு மட்டுமே, முதலீட்டு ஆலோசனை அல்ல.
இந்த எண்களைப் பயன்படுத்துகிறீர்களா? “Flash Finance (Vahan data)” என்பதை இந்தப் பக்கத்தின் இணைப்புடன் மேற்கோள் காட்டுங்கள். இந்த அறிக்கையின் சார்ட் கார்டு அதே வரவுடன் மீண்டும் வெளியிட இலவசம்.