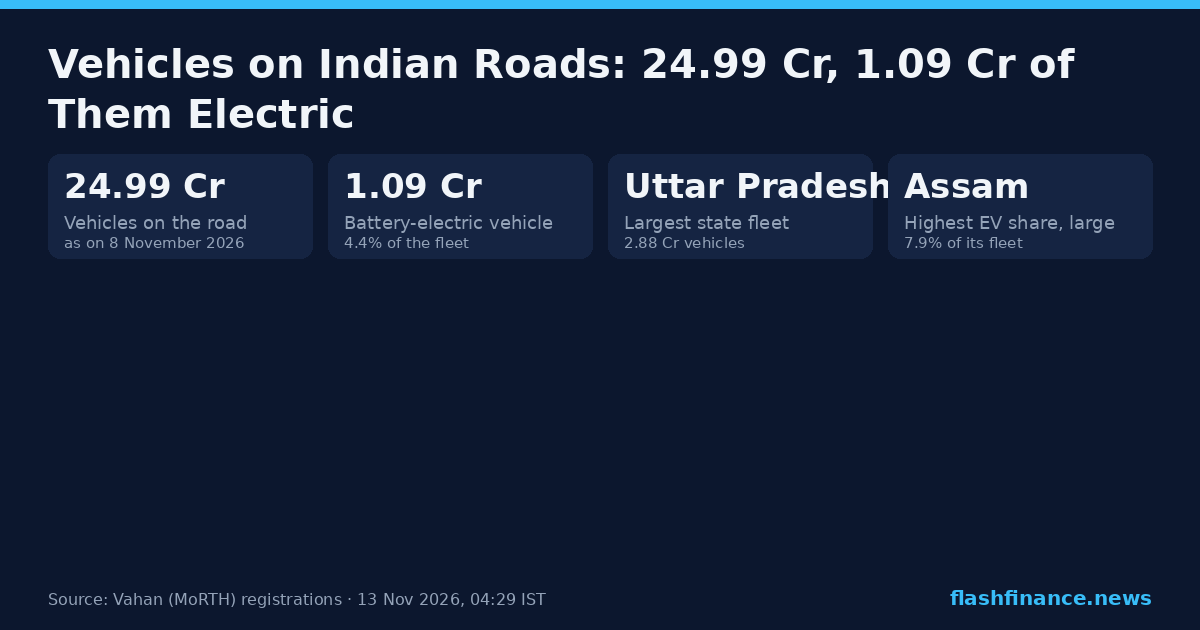
Vehicles on Indian Roads: 24.99 Cr, 1.09 Cr of Them Electric
How many vehicles India has on the road, from the national Vahan register: by vehicle type, by fuel and by state, with the electric fleet for every state.
India's vehicle fleet, 8 November 2026
24,98,75,078 vehicles were active on the Vahan register as on 8 November 2026: every vehicle registered in India and not since scrapped, de-registered or archived. 1,09,45,531 of them, 4.4%, are battery electric. Since 14 October 2026 the fleet has changed by +0.32% and the electric fleet by +3.04%.
This is a stock, not a flow. The monthly reports count vehicles registered in a month; this page counts what is still on the register. A vehicle bought in 2010 and still running is in it; one scrapped last year is not.
What is on the road
Two-wheelers make up 68.9% of the fleet. Vahan's light motor vehicle group is mostly private cars and jeeps, but tractors and other light vehicles are filed in it too, so it is shown under Vahan's own name.
Fleet by vehicle type, 8 November 2026
Groups of Vahan's own vehicle sub-categories.
| வகை | Vehicles | பங்கு |
|---|---|---|
| Two-wheelers | 17,20,84,022 | 68.9% |
| Light motor vehicles (private) | 5,50,99,061 | 22.1% |
| Light passenger vehicles (taxis, cabs) | 30,88,174 | 1.2% |
| Three-wheelers | 79,86,188 | 3.2% |
| Goods vehicles | 1,00,55,578 | 4.0% |
| பேருந்துகள் | 7,35,439 | 0.3% |
| மற்றவை | 8,26,600 | 0.3% |
Two-wheelers and three-wheelers include transport, non-transport and invalid-carriage registrations. Goods vehicles are light, medium and heavy; buses are medium and heavy passenger vehicles.
What it runs on
Petrol vehicles are 77.5% of the fleet and diesel 13.1%. Battery electrics are 4.4%: far below their share of new registrations, because the fleet turns over slowly.
| எரிபொருள் | Vehicles | பங்கு |
|---|---|---|
| பெட்ரோல் | 19,36,68,368 | 77.5% |
| டீசல் | 3,27,88,741 | 13.1% |
| CNG / LPG | 97,03,381 | 3.9% |
| மின்சார | 1,09,45,531 | 4.4% |
| ஹைப்ரிட் | 20,92,432 | 0.8% |
| மற்றவை | 6,76,625 | 0.3% |
Hybrids are counted separately from battery electrics.
Every state
Uttar Pradesh has the largest fleet, 2,88,34,277 vehicles, followed by Maharashtra (2,57,74,451). Among states with at least 1% of the national fleet, Assam has the highest electric share, 7.9%.
| # | மாநிலம் | Vehicles | இந்தியாவின் பங்கு | மின்சார | EV பங்கு | CNG / LPG share |
|---|---|---|---|---|---|---|
| 1 | உத்தர பிரதேசம் | 2,88,34,277 | 11.5% | 18,91,492 | 6.6% | 4.2% |
| 2 | மகாராஷ்டிரா | 2,57,74,451 | 10.3% | 12,35,195 | 4.8% | 7.8% |
| 3 | Tamil Nadu | 2,01,27,353 | 8.1% | 7,48,595 | 3.7% | 2.1% |
| 4 | கர்நாடகா | 1,91,99,822 | 7.7% | 9,59,575 | 5.0% | 2.9% |
| 5 | குஜராத் | 1,74,62,377 | 7.0% | 4,38,578 | 2.5% | 9.9% |
| 6 | கேரளா | 1,41,09,532 | 5.6% | 4,55,174 | 3.2% | 1.1% |
| 7 | ராஜஸ்தான் | 1,33,97,143 | 5.4% | 6,05,079 | 4.5% | 3.8% |
| 8 | மத்தியப் பிரதேசம் | 1,27,18,505 | 5.1% | 5,45,445 | 4.3% | 2.8% |
| 9 | மேற்கு வங்காளம் | 1,11,27,385 | 4.5% | 3,66,853 | 3.3% | 1.3% |
| 10 | ஆந்திரப் பிரதேசம் | 1,08,63,941 | 4.3% | 2,98,384 | 2.7% | 1.0% |
| 11 | பீகார் | 99,90,080 | 4.0% | 5,84,964 | 5.9% | 1.6% |
| 12 | தெலங்கானா | 92,45,457 | 3.7% | 3,80,727 | 4.1% | 2.2% |
| 13 | ஹரியானா | 88,71,846 | 3.6% | 2,00,823 | 2.3% | 9.8% |
| 14 | டெல்லி | 72,80,700 | 2.9% | 5,58,550 | 7.7% | 12.5% |
| 15 | பஞ்சாப் | 72,02,627 | 2.9% | 1,92,194 | 2.7% | 1.3% |
| 16 | ஒடிசா | 69,83,443 | 2.8% | 3,67,734 | 5.3% | 0.6% |
| 17 | சத்தீஸ்கர் | 52,31,490 | 2.1% | 2,27,318 | 4.3% | 0.1% |
| 18 | அசாம் | 50,64,221 | 2.0% | 3,98,439 | 7.9% | 0.1% |
| 19 | ஜார்க்கண்ட் | 50,17,769 | 2.0% | 1,48,227 | 3.0% | 0.9% |
| 20 | உத்தரகண்ட் | 26,38,274 | 1.1% | 1,18,840 | 4.5% | 1.6% |
| 21 | Jammu & Kashmir | 19,98,145 | 0.8% | 56,711 | 2.8% | 0.9% |
| 22 | இமாச்சலப் பிரதேசம் | 17,50,084 | 0.7% | 9,082 | 0.5% | 0.3% |
| 23 | கோவா | 10,89,392 | 0.4% | 48,940 | 4.5% | 0.8% |
| 24 | புதுச்சேரி | 6,78,119 | 0.3% | 21,374 | 3.2% | 0.6% |
| 25 | சண்டிகர் | 6,50,856 | 0.3% | 27,829 | 4.3% | 1.5% |
| 26 | திரிபுரா | 6,00,746 | 0.2% | 46,405 | 7.7% | 9.1% |
| 27 | மேகாலயா | 3,92,710 | 0.2% | 2,844 | 0.7% | 0.0% |
| 28 | மிசோரம் | 2,85,421 | 0.1% | 2,853 | 1.0% | 0.0% |
| 29 | அருணாச்சலப் பிரதேசம் | 2,75,266 | 0.1% | 340 | 0.1% | 0.1% |
| 30 | நாகாலாந்து | 2,60,732 | 0.1% | 132 | 0.1% | 0.6% |
| 31 | மணிப்பூர் | 2,36,791 | 0.1% | 4,426 | 1.9% | 0.1% |
| 32 | UT of DNH and DD | 2,18,874 | 0.1% | 1,411 | 0.6% | 5.5% |
| 33 | அந்தமான் & நிக்கோபார் தீவுகள் | 1,21,501 | 0.0% | 620 | 0.5% | 0.0% |
| 34 | சிக்கிம் | 1,19,216 | 0.0% | 45 | 0.0% | 0.0% |
| 35 | லடாக் | 41,392 | 0.0% | 109 | 0.3% | 0.1% |
| 36 | லட்சத்தீவு | 15,140 | 0.0% | 224 | 1.5% | 0.1% |
அடிக்கடி கேட்கப்படும் கேள்விகள்
How many vehicles are there in India?
How many electric vehicles are on Indian roads?
Which state has the most vehicles?
இந்தத் தரவு எங்கிருந்து வருகிறது?
அறிக்கைப் பிரிவிலிருந்து மேலும்
மூலம். ஒவ்வொரு எண்ணும் விற்பனையை அல்ல, பதிவேட்டில் உள்ள வாகனங்களை எண்ணுகிறது: அந்தத் தரவு எடுக்கப்பட்ட தேதியின்படி செயலில் உள்ள வாகனங்கள், சாலைப் போக்குவரத்து மற்றும் நெடுஞ்சாலைகள் அமைச்சகத்தின் Vahan பொது டாஷ்போர்டிலிருந்து (analytics.parivahan.gov.in) எடுக்கப்பட்டது; அதன் எரிபொருள், வாகன வகை மற்றும் மாநில மொத்தங்கள் ஒத்துப்போகும்போது மட்டுமே படிக்கப்பட்டு வெளியிடப்படும். அழிக்கப்பட்ட, பதிவு நீக்கப்பட்ட மற்றும் காப்பகப்படுத்தப்பட்ட வாகனங்கள் எண்ணிக்கையில் சேர்க்கப்படுவதில்லை. "மின்சார" என்பது பேட்டரி மின்சார வாகனத்தைக் குறிக்கிறது; ஹைப்ரிட்கள் தனியாக எண்ணப்படுகின்றன. தகவலுக்கு மட்டுமே, முதலீட்டு ஆலோசனை அல்ல.
இந்த எண்களைப் பயன்படுத்துகிறீர்களா? “Flash Finance (Vahan data)” என்பதை இந்தப் பக்கத்தின் இணைப்புடன் மேற்கோள் காட்டுங்கள். இந்த அறிக்கையின் சார்ட் கார்டு அதே வரவுடன் மீண்டும் வெளியிட இலவசம்.