Three-Wheeler Sales September 2025: Bajaj Auto Leads, 1,08,304 Units Registered
செப்டம்பர் 2025க்கான முழு Vahan பதிவு அறிக்கை — ஒவ்வொரு முக்கிய உற்பத்தியாளரின் தரவரிசை, மாதத்துக்கு மாதம் மற்றும் ஆண்டுக்கு ஆண்டு மாற்றம், பிரிவுப் பங்கு, எரிபொருள் கலவை மற்றும் மாநில வாரியான நிலவரம்.
How September went
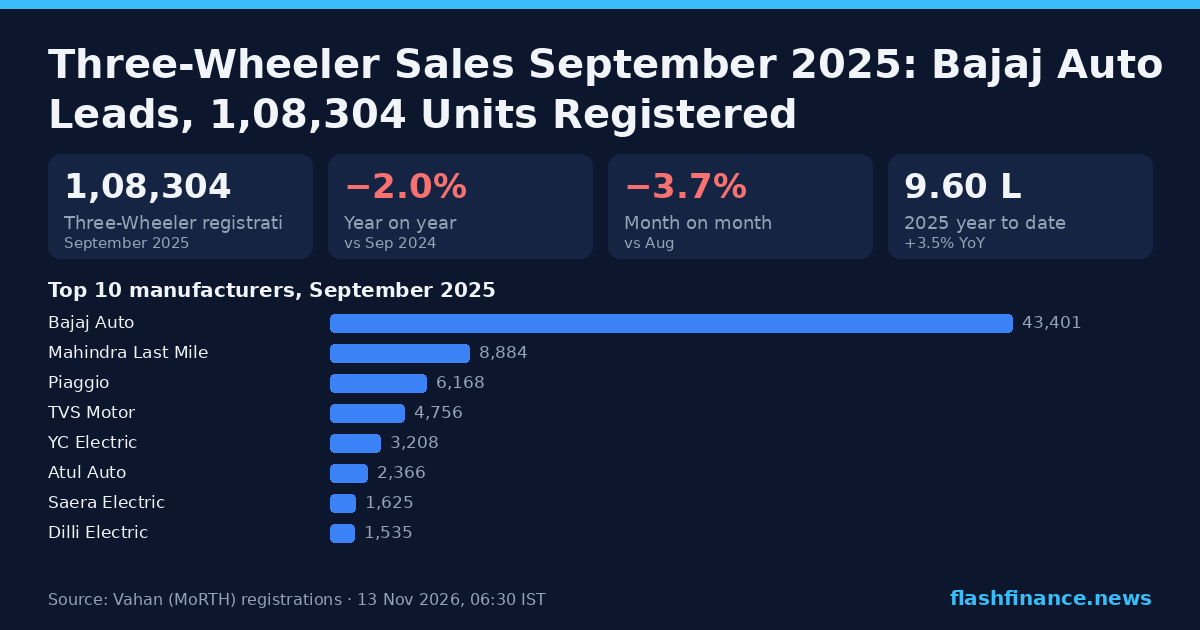
India's three-wheeler market registered 1,08,304 vehicles in September 2025. Volumes eased 2.0% against September 2024, and eased 3.7% on August.
இந்த ஆண்டு இதுவரை 9 மாதங்களில் 9,59,571 யூனிட்டுகள் பதிவாகியுள்ளன, இது 2024 (9,27,263)-இன் இதே காலகட்டத்தை விட +3.5% அதிகம். அந்தப் பிரிவு, அந்த மாதம் இந்தியாவில் பதிவான ஒவ்வொரு வாகனத்திலும் 5.6%-ஐக் கொண்டிருந்தது.
September is the quiet month before the festive peak — buyers routinely defer registrations into the auspicious October window.
Monthly three-wheeler registrations, 2023–2026
ஒவ்வொரு காலண்டர் ஆண்டுக்கும் ஒரு கோடு — ஆண்டின் மொத்தம் மட்டுமல்ல, அதன் போக்கும். நடப்பு ஆண்டின் புள்ளிக் கோடிட்ட முனை இதுவரை உள்ள மாதத்தைக் காட்டுகிறது.
உற்பத்தியாளர் மதிப்பெண்பட்டியல்
Bajaj Auto led the segment with 43,401 registrations, ahead of Mahindra Last Mile on 8,884 — a gap of 34,517 units, wider than the 34,324 it held in August.
TVS Motor grew fastest among the segment's biggest names at +125.1% year on year (4,756 units); Saera Electric had the hardest month of that group, down 35.4% to 1,625.
On share rather than volume — the number that decides who is actually winning — TVS Motor has added 1.71pp of the segment in 2025, while Bajaj Auto has given up 1.12pp.
முதல் 10 உற்பத்தியாளர்கள், செப்டம்பர் 2025
மாதத்தின் பதிவுகள்
மாதத்தின் பதிவுகளின் அடிப்படையில் தரவரிசைப்படுத்தப்பட்டது; மாதாந்திர (MoM) மற்றும் ஆண்டு (YoY) மாற்றத்துடன். முழு டேஷ்போர்டைக் காண ஒரு பெயரைக் கிளிக் செய்யவும்.
| # | உற்பத்தியாளர் | செப். 2025 | MoM | YoY | மூன்று சக்கர வாகனங்களின் பங்கு |
|---|---|---|---|---|---|
| 1 | Bajaj Auto | 43,401 | −0.7% | +5.9% | 40.07% |
| 2 | Mahindra Last Mile | 8,884 | −5.2% | +33.4% | 8.20% |
| 3 | Piaggio | 6,168 | −13.1% | −23.2% | 5.70% |
| 4 | TVS Motor | 4,756 | −0.2% | +125.1% | 4.39% |
| 5 | YC Electric | 3,208 | −6.2% | −16.2% | 2.96% |
| 6 | Atul Auto | 2,366 | +12.4% | +8.4% | 2.18% |
| 7 | Saera Electric | 1,625 | −25.1% | −35.4% | 1.50% |
| 8 | Dilli Electric | 1,535 | −15.4% | −26.8% | 1.42% |
| 9 | Mini Metro EV | 970 | −15.2% | −17.4% | 0.90% |
| 10 | Energy Electric Vehicles | 866 | −19.7% | −27.9% | 0.80% |
| 11 | J. S. Auto | 866 | −8.4% | −12.3% | 0.80% |
| 12 | Sahnianand E Vehicles | 862 | +0.8% | −2.6% | 0.80% |
| 13 | Zeniak Innovation India | 845 | +8.3% | +0.8% | 0.78% |
| 14 | Unique International Ev | 815 | −6.5% | −32.0% | 0.75% |
| 15 | Hotage India | 731 | +1.2% | −34.4% | 0.67% |
Registrations inside the segment only, counted with Vahan's own vehicle-class filter, so each number is that manufacturer's three-wheeler volume. Companies that file electric models under a maker of their own (Tata, Mahindra) appear as separate rows.
ஆண்டு தொடக்கம் முதல் சந்தைப் பங்கு
Share is measured inside the segment itself — only three-wheeler volume counts on either side of the ratio. Volume is full-year 2025. The comparison is against the whole of 2024.
முழு ஆண்டு 2025,-இல் உற்பத்தியாளர் வாரியாக பிரிவு வால்யூம் துல்லியமாக, முழு ஆண்டு 2024-உடன் ஒப்பிட்ட சந்தைப் பங்கு மாற்றத்துடன்.
| # | உற்பத்தியாளர் | 2025 யூனிட்கள் | பங்கு | முழு ஆண்டு 2024-உடன் ஒப்பீடு |
|---|---|---|---|---|
| 1 | Bajaj Auto | 4,96,319 | 36.41% | −1.12pp |
| 2 | Mahindra Last Mile | 1,03,619 | 7.60% | +1.69pp |
| 3 | Piaggio | 90,911 | 6.67% | −1.05pp |
| 4 | TVS Motor | 49,497 | 3.63% | +1.71pp |
| 5 | YC Electric | 41,206 | 3.02% | −0.46pp |
| 6 | Atul Auto | 30,596 | 2.24% | +0.10pp |
| 7 | Saera Electric | 24,791 | 1.82% | −0.42pp |
| 8 | Dilli Electric | 21,906 | 1.61% | −0.37pp |
| 9 | Zeniak Innovation India | 13,398 | 0.98% | +0.47pp |
| 10 | Mini Metro EV | 13,055 | 0.96% | −0.21pp |
| 11 | Energy Electric Vehicles | 12,792 | 0.94% | −0.12pp |
| 12 | J. S. Auto | 12,423 | 0.91% | 0.00pp |
| 13 | Sahnianand E Vehicles | 11,412 | 0.84% | +0.04pp |
| 14 | Unique International Ev | 11,235 | 0.82% | −0.26pp |
| 15 | Terra Motors India | 10,533 | 0.77% | +0.08pp |
எரிபொருள் கலவை
Electric accounts for 58.7% of the segment's registrations in 2025. Electric is at 58.74%, a move of +3.76pp on 2024 on volume of 8,00,616 units.
Three-Wheeler fuel mix, 2025
இன்றுவரையிலான ஆண்டில் பிரிவு பதிவுகளில் பங்கு
2025 முழு ஆண்டுக் கலவை.
| எரிபொருள் | 2025 யூனிட்கள் | பங்கு | முழு ஆண்டு 2024-உடன் ஒப்பீடு |
|---|---|---|---|
| மின்சார | 8,00,616 | 58.74% | +3.76pp |
| CNG / LPG | 3,90,331 | 28.64% | −3.55pp |
| டீசல் | 1,66,582 | 12.22% | +0.29pp |
| பெட்ரோல் | 5,415 | 0.40% | −0.49pp |
| மற்றவை | 111 | 0.01% | −0.01pp |
இந்த அறிக்கையின் வரம்புக்குள் முழு ஆண்டு 2025,-இன் பங்கு, முழு 2024-உடன் ஒப்பிடும்போது.
தேவை எங்கே உள்ளது
Uttar Pradesh was the largest market in full-year 2025 with 3,09,285 registrations, 22.7% of the segment's national total. Bihar (1,19,633) and Maharashtra (94,498) followed. West Bengal has gained the most ground, adding 3.67pp of the national total.
முழு ஆண்டு 2025,-இல் மாநில வாரியாக பிரிவின் பதிவுகள்.
| # | மாநிலம் | யூனிட்கள் | பங்கு | முழு ஆண்டு 2024-உடன் ஒப்பீடு |
|---|---|---|---|---|
| 1 | உத்தர பிரதேசம் | 3,09,285 | 22.7% | −1.88pp |
| 2 | பீகார் | 1,19,633 | 8.8% | −0.78pp |
| 3 | மகாராஷ்டிரா | 94,498 | 6.9% | +0.03pp |
| 4 | குஜராத் | 87,262 | 6.4% | −0.07pp |
| 5 | அசாம் | 85,543 | 6.3% | +0.39pp |
| 6 | மேற்கு வங்காளம் | 79,816 | 5.9% | +3.67pp |
| 7 | கர்நாடகா | 69,087 | 5.1% | −0.77pp |
| 8 | டெல்லி | 67,728 | 5.0% | +1.30pp |
| 9 | மத்தியப் பிரதேசம் | 55,287 | 4.1% | −0.07pp |
| 10 | தெலங்கானா | 54,813 | 4.0% | +0.60pp |
| 11 | Tamil Nadu | 54,318 | 4.0% | −0.37pp |
| 12 | ராஜஸ்தான் | 44,108 | 3.2% | −0.61pp |
அடிக்கடி கேட்கப்படும் கேள்விகள்
How many three-wheelers were sold in India in September 2025?
Which company sold the most three-wheelers in September 2025?
What is the three-wheeler market share in India in 2025?
What share of three-wheelers sold in India are electric?
Which state registers the most three-wheelers in India?
இவை மொத்த விற்பனை அனுப்பல்களா அல்லது சில்லறை விற்பனையா?
Three-Wheeler sales, earlier months
அறிக்கைப் பிரிவிலிருந்து மேலும்
மூலம். ஒவ்வொரு எண்ணும் ஒரு வாகன பதிவு; சாலைப் போக்குவரத்து மற்றும் நெடுஞ்சாலைகள் அமைச்சகத்தின் Vahan 4 டாஷ்போர்டிலிருந்து (vahan.parivahan.gov.in) எடுக்கப்பட்டது — சில்லறை தரவுக்கு FADA மற்றும் தொழில்துறை பயன்படுத்தும் அதே மூலம். பதிவுகள் என்பவை உற்பத்தியாளர்கள் ஒவ்வொரு மாதமும் அறிவிக்கும் மொத்த விநியோக எண்ணிக்கைகள் அல்ல. "EV" என்பது பேட்டரி மின்சார வாகனத்தைக் குறிக்கிறது (Vahan எரிபொருள் வகைகள் PURE EV மற்றும் ELECTRIC(BOV)); ஹைப்ரிட்கள் தனியாக எண்ணப்படுகின்றன. தகவலுக்கு மட்டுமே, முதலீட்டு ஆலோசனை அல்ல.
இந்த எண்களைப் பயன்படுத்துகிறீர்களா? “Flash Finance (Vahan data)” என்பதை இந்தப் பக்கத்தின் இணைப்புடன் மேற்கோள் காட்டுங்கள். இந்த அறிக்கையின் சார்ட் கார்டு அதே வரவுடன் மீண்டும் வெளியிட இலவசம்.