Electric Car Sales March 2024: Tata Motors (EV) Leads With 67.9% Share
Every electric car registered in India in March 2024, brand by brand: volumes, market share inside the segment, month-on-month and year-on-year change, and who gained or lost share.
மார்ச் எப்படி இருந்தது
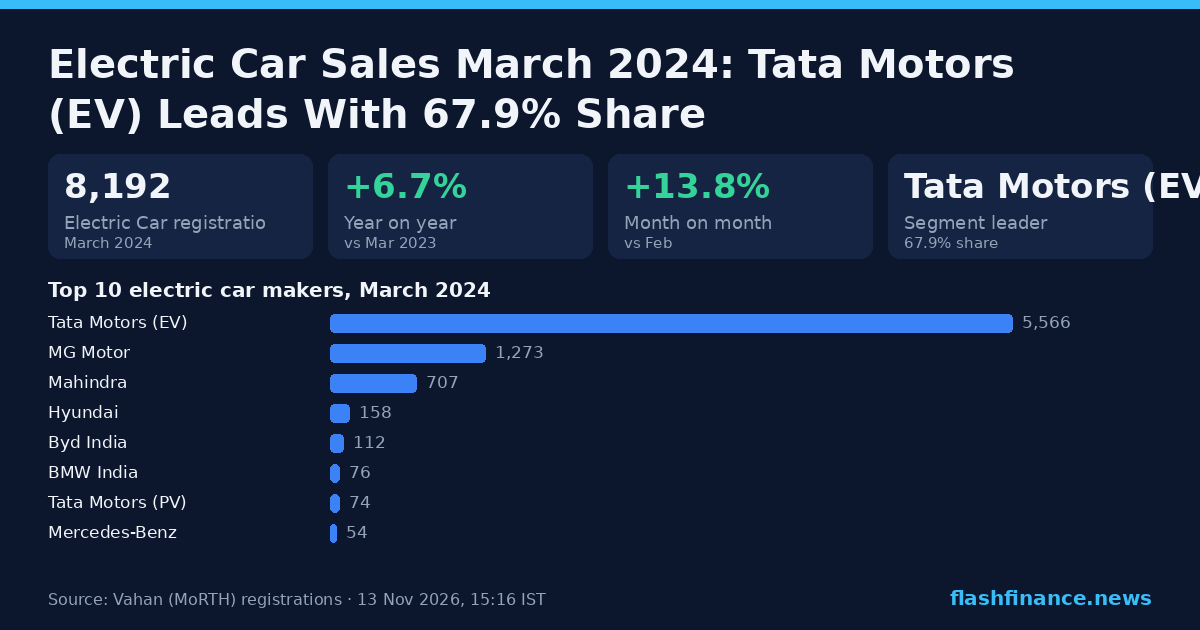
India registered 8,192 electric cars in March 2024, +6.7% on March 2023 and +13.8% on February.
Across the 3 completed months of 2024 to March, 22,890 electric cars have been registered, +45.0% on the same months of 2023.
Electric cars were 2.6% of every car registered in March 2024, against 2.3% in March 2023 (+0.3pp).
Monthly electric car registrations, 2023–2026
ஒவ்வொரு காலண்டர் ஆண்டுக்கும் ஒரு கோடு. நடப்பு ஆண்டின் கோடிட்ட முனை என்பது இதுவரையிலான மாதத்தைக் குறிக்கிறது.
Electric Car market share, March 2024
Tata Motors (EV) led the month with 5,566 registrations — 67.9% of the electric car market — ahead of MG Motor on 1,273 (15.5%), a gap of 4,293 units. Tata Motors (EV) also led February.
Tata Motors (EV) has gained the most share against March 2023, +67.92pp to 67.9%; Tata Motors (PV) has lost the most, −77.51pp to 0.9%.
The top three hold 92.1% of the segment; 16 manufacturers registered at least one electric car.
Top 10 electric car makers, March 2024
Electric car registrations only — every other vehicle type these companies make is excluded.
Share is of every electric car registered in the month. MoM and YoY compare each maker's own volume; the last column is its change in share of the segment.
| # | உற்பத்தியாளர் | மார். 2024 | பங்கு | MoM | YoY | மார். 2023 உடன் பங்கு ஒப்பீடு |
|---|---|---|---|---|---|---|
| 1 | Tata Motors (EV) | 5,566 | 67.9% | +19.4% | — | +67.92pp |
| 2 | MG Motor | 1,273 | 15.5% | +7.1% | +116.5% | +7.88pp |
| 3 | Mahindra | 707 | 8.6% | +4.1% | +165.8% | +5.17pp |
| 4 | Hyundai | 158 | 1.9% | +22.5% | +167.8% | +1.16pp |
| 5 | Byd India | 112 | 1.4% | +0.0% | −58.7% | −2.16pp |
| 6 | BMW India | 76 | 0.9% | −33.3% | +16.9% | +0.08pp |
| 7 | Tata Motors (PV) | 74 | 0.9% | −30.8% | −98.8% | −77.51pp |
| 8 | Mercedes-Benz | 54 | 0.7% | +14.9% | +28.6% | +0.11pp |
| 9 | Volvo | 52 | 0.6% | +10.6% | −1.9% | −0.06pp |
| 10 | Stellantis Automobiles India | 42 | 0.5% | −28.8% | −80.7% | −2.33pp |
| 11 | Kia India | 35 | 0.4% | +52.2% | +40.0% | +0.10pp |
| 12 | Porsche Ag Germany | 18 | 0.2% | +500.0% | +157.1% | +0.13pp |
| 13 | Audi Ag | 9 | 0.1% | −60.9% | +50.0% | +0.03pp |
| 14 | மற்றவை | 8 | 0.1% | +700.0% | +100.0% | +0.05pp |
| 15 | Byd Auto | 7 | 0.1% | +133.3% | −84.1% | −0.49pp |
| மற்றவை (1 உற்பத்தியாளர்கள்) | 1 | 0.0% |
துல்லியமானது: பேட்டரி-மின்சார எரிபொருட்களுக்கு (PURE EV, ELECTRIC(BOV)) மற்றும் பிரிவின் வாகன வகைகளுக்கு வடிகட்டப்பட்ட Vahan-இன் உற்பத்தியாளர் x மாத அட்டவணை — எதனாலும் பெருக்கப்பட்ட நிறுவன மொத்தம் அல்ல.
முன்னேறுவது யார்?
Monthly share of the electric car market for the six largest makers this month, over the last 15 completed months.
Electric Car market share by month
ஒவ்வொரு மாதமும் பிரிவின் பங்கு, சதவீதத்தில்.
Market share, 2024 to March
The same table over 2024 to March, set against the same months of 2023.
| # | உற்பத்தியாளர் | யூனிட்கள் | பங்கு | 2023-உடன் | வால்யூம் YoY |
|---|---|---|---|---|---|
| 1 | Tata Motors (EV) | 14,727 | 64.34% | +64.33pp | — |
| 2 | MG Motor | 3,745 | 16.36% | +6.62pp | +143.7% |
| 3 | Mahindra | 2,184 | 9.54% | +7.82pp | +705.9% |
| 4 | Hyundai | 466 | 2.04% | +0.33pp | +72.6% |
| 5 | Byd India | 366 | 1.60% | −2.12pp | −37.6% |
| 6 | Tata Motors (PV) | 365 | 1.59% | −74.89pp | −97.0% |
| 7 | BMW India | 353 | 1.54% | −0.11pp | +35.2% |
| 8 | Mercedes-Benz | 172 | 0.75% | −0.15pp | +21.1% |
| 9 | Volvo | 159 | 0.69% | −0.05pp | +34.7% |
| 10 | Stellantis Automobiles India | 134 | 0.59% | −0.80pp | −38.5% |
| 11 | Kia India | 98 | 0.43% | −0.37pp | −22.2% |
| 12 | Audi Ag | 47 | 0.21% | +0.04pp | +80.8% |
| 13 | Porsche Ag Germany | 32 | 0.14% | +0.06pp | +146.2% |
| 14 | Byd Auto | 21 | 0.09% | −0.46pp | −75.9% |
| 15 | மற்றவை | 10 | 0.04% | −0.08pp | −47.4% |
How electric are cars?
The battery-electric share of all cars registered each month — the adoption curve behind the brand race above.
EV share of cars by month
Battery-electric registrations as a per cent of the whole segment. The dashed end of the current year is the month so far.
How electric is each car maker?
Every car maker's March 2024 volume, split into battery-electric and everything else (petrol, diesel, CNG and hybrid). Leave the EVs out and Maruti Suzuki leads the non-electric cars market with 37.6%.
Among the established makers, MG Motor has gone furthest: 31.3% of its cars were electric.
| # | உற்பத்தியாளர் | All cars | மின்சார | Non-EV | அதன் விற்பனையில் EV பங்கு | EV அல்லாத சந்தையின் பங்கு |
|---|---|---|---|---|---|---|
| 1 | Maruti Suzuki | 1,13,862 | 0 | 1,13,862 | 0.0% | 37.6% |
| 2 | Tata Motors (PV) | 45,894 | 5,640 | 40,254 | 12.3% | 13.3% |
| 3 | Hyundai | 44,980 | 158 | 44,822 | 0.4% | 14.8% |
| 4 | Mahindra | 38,792 | 707 | 38,085 | 1.8% | 12.6% |
| 5 | Kia India | 20,753 | 35 | 20,718 | 0.2% | 6.8% |
| 6 | Toyota Kirloskar | 18,589 | 0 | 18,589 | 0.0% | 6.1% |
| 7 | Honda Cars | 6,571 | 0 | 6,571 | 0.0% | 2.2% |
| 8 | Skoda | 6,263 | 0 | 6,263 | 0.0% | 2.1% |
| 9 | MG Motor | 4,066 | 1,273 | 2,793 | 31.3% | 0.9% |
| 10 | Renault India | 3,828 | 0 | 3,828 | 0.0% | 1.3% |
| 11 | Nissan India | 2,126 | 0 | 2,126 | 0.0% | 0.7% |
| 12 | Mercedes-Benz | 1,722 | 54 | 1,668 | 3.1% | 0.6% |
| 13 | BMW India | 1,203 | 76 | 1,127 | 6.3% | 0.4% |
| 14 | Stellantis Automobiles India | 459 | 42 | 417 | 9.2% | 0.1% |
| 15 | Stellantis India | 373 | 0 | 373 | 0.0% | 0.1% |
All cars: Vahan maker x month for the segment's vehicle classes, every fuel. Electric: the same table, battery-electric fuels only. Non-EV is the difference — petrol, diesel, CNG and hybrid. EV arms filed as separate makers are counted with their parent: Tata Motors (EV) with Tata Motors (PV).
எங்கே விற்கிறார்கள்
Maharashtra registered the most electric cars in March 2024 — 1,077, 13.1% of the national total. Kerala (1,007) and Karnataka (1,005) followed.
| # | மாநிலம் | யூனிட்கள் | பங்கு | YoY |
|---|---|---|---|---|
| 1 | மகாராஷ்டிரா | 1,077 | 13.1% | −14.1% |
| 2 | கேரளா | 1,007 | 12.3% | −8.5% |
| 3 | கர்நாடகா | 1,005 | 12.3% | +20.6% |
| 4 | Tamil Nadu | 668 | 8.2% | +17.0% |
| 5 | குஜராத் | 666 | 8.1% | +39.6% |
| 6 | ராஜஸ்தான் | 503 | 6.1% | +15.6% |
| 7 | டெல்லி | 482 | 5.9% | −29.9% |
| 8 | உத்தர பிரதேசம் | 430 | 5.2% | +2.1% |
| 9 | தெலங்கானா | 381 | 4.7% | −25.3% |
| 10 | ஆந்திரப் பிரதேசம் | 371 | 4.5% | +120.8% |
| 11 | ஒடிசா | 207 | 2.5% | +195.7% |
| 12 | மத்தியப் பிரதேசம் | 193 | 2.4% | +21.4% |
அடிக்கடி கேட்கப்படும் கேள்விகள்
How many electric cars were sold in India in March 2024?
Which company sold the most electric cars in March 2024?
What is the electric car market share of each brand?
இந்தியாவில் விற்கப்படும் கார்களில் எத்தனை சதவீதம் மின்சார கார்கள்?
Which state buys the most electric cars?
இந்த எண்கள் எவ்வாறு அளவிடப்படுகின்றன?
Electric Car sales, earlier months
அறிக்கைப் பிரிவிலிருந்து மேலும்
மூலம். ஒவ்வொரு எண்ணும் ஒரு வாகன பதிவு; சாலைப் போக்குவரத்து மற்றும் நெடுஞ்சாலைகள் அமைச்சகத்தின் Vahan 4 டாஷ்போர்டிலிருந்து (vahan.parivahan.gov.in) எடுக்கப்பட்டது — சில்லறை தரவுக்கு FADA மற்றும் தொழில்துறை பயன்படுத்தும் அதே மூலம். பதிவுகள் என்பவை உற்பத்தியாளர்கள் ஒவ்வொரு மாதமும் அறிவிக்கும் மொத்த விநியோக எண்ணிக்கைகள் அல்ல. "EV" என்பது பேட்டரி மின்சார வாகனத்தைக் குறிக்கிறது (Vahan எரிபொருள் வகைகள் PURE EV மற்றும் ELECTRIC(BOV)); ஹைப்ரிட்கள் தனியாக எண்ணப்படுகின்றன. தகவலுக்கு மட்டுமே, முதலீட்டு ஆலோசனை அல்ல.
இந்த எண்களைப் பயன்படுத்துகிறீர்களா? “Flash Finance (Vahan data)” என்பதை இந்தப் பக்கத்தின் இணைப்புடன் மேற்கோள் காட்டுங்கள். இந்த அறிக்கையின் சார்ட் கார்டு அதே வரவுடன் மீண்டும் வெளியிட இலவசம்.