Chandigarh Vehicle Registrations December 2025: 4,152 Units, +17.7% YoY
Full Vahan registration report for Chandigarh in December 2025 — a market where cars and UVs are 42% of registrations against 15% nationally in 2025 — total volume, year-on-year and month-on-month change, where the state ranks nationally, and the segment and fuel mix behind the number.
Chandigarh in December 2025
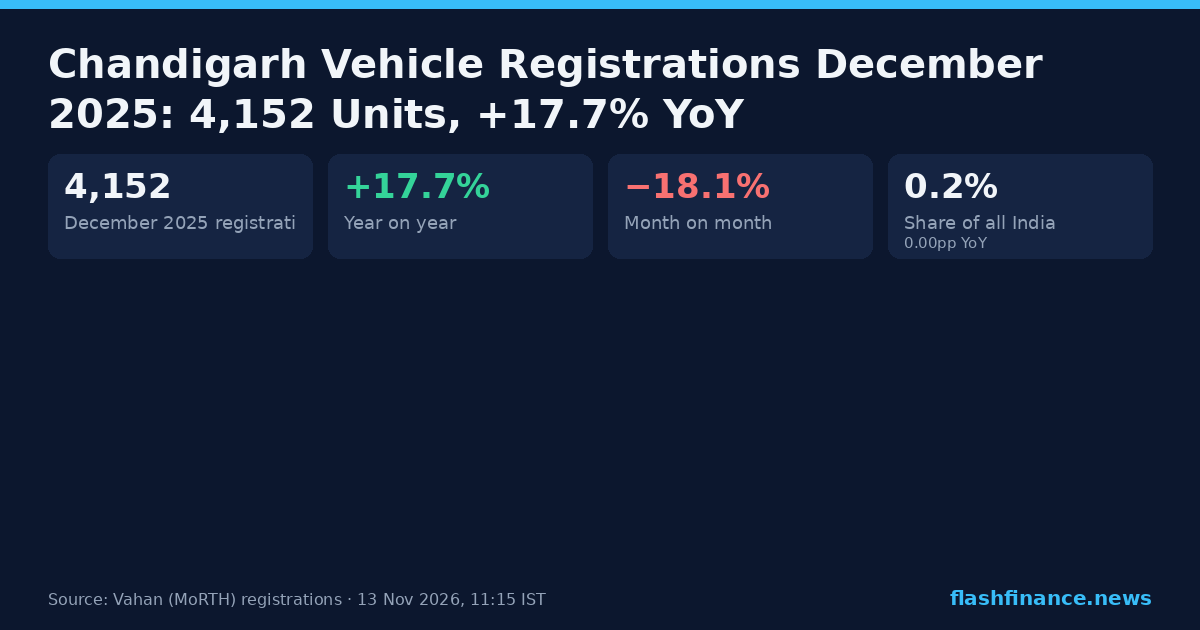
4,152 vehicles were registered in Chandigarh in December 2025. Volume grew strongly 17.7% against December 2024 and contracted 18.1% against November. Its best month on record remains October 2024 at 6,922.
That made Chandigarh the 26th largest vehicle market in India in December 2025, behind Tripura on 5,002 and ahead of Manipur on 3,778.
That is 0.2% of every vehicle registered in the country that month, 0.00pp against December 2024.
Across 2025 to date — the 12 months of the year that have closed — Chandigarh has registered 50,942 vehicles, +9.8% on the same months of 2024.
Chandigarh monthly registrations
Every calendar year on record, month by month. The dashed end of the current year is the month so far.
What Chandigarh buys
49.7% of everything registered in Chandigarh in 2025 is two-wheelers, and the state accounts for 0.1% of that segment nationally. Against the national mix, Chandigarh skews towards cars and UVs — +27.48pp more of its book than India as a whole.
This split is the calendar year to date. Our Vahan data holds a state's registrations by month, and a state's registrations by vehicle class, but not the two together — so the volumes here cover 2025 rather than December 2025 alone. It holds no manufacturer-by-state table either, which is why no page here says which brand leads in Chandigarh.
Chandigarh by segment, 2025
Calendar year to date — exact, but with no month axis.
| பிரிவு | 2025 யூனிட்கள் | Share of state | Share of segment | vs national mix |
|---|---|---|---|---|
| இருசக்கர வாகனங்கள் | 25,338 | 49.7% | 0.1% | −22.02pp |
| கார்கள் & UVகள் | 21,423 | 42.1% | 0.5% | +27.48pp |
| மூன்று சக்கர வாகனங்கள் | 2,157 | 4.2% | 0.2% | −0.42pp |
| சரக்கு வாகனங்கள் | 816 | 1.6% | 0.1% | −1.51pp |
| பேருந்துகள் | 744 | 1.5% | 0.6% | +1.03pp |
| மற்றவை | 287 | 0.6% | 0.1% | −0.21pp |
| டாக்சிகள் & கேப்கள் | 159 | 0.3% | 0.0% | −0.91pp |
| டிராக்டர்கள் | 18 | 0.0% | 0.0% | −3.42pp |
"Share of segment" is this state against every other state in the same segment. "vs national mix" is how much more (or less) of this state's book the segment is than it is of India's.
What Chandigarh runs on
10.2% of Chandigarh's 2025 registrations are battery electric — 5,173 vehicles, against a national average of 8.0%. A year earlier the state was at 13.3%. CNG and LPG account for 1.8% here against 5.3% nationally.
Fuel, like segment, is published against the state for the whole calendar year rather than by month, so these shares are 2025 to date. Hybrids are counted separately from battery electrics.
| எரிபொருள் | 2025 யூனிட்கள் | Share in state | Share in India | 2024-உடன் |
|---|---|---|---|---|
| பெட்ரோல் | 34,926 | 68.6% | 74.9% | +2.29pp |
| டீசல் | 6,275 | 12.3% | 10.2% | +0.88pp |
| CNG / LPG | 928 | 1.8% | 5.3% | +0.31pp |
| மின்சார | 5,173 | 10.2% | 8.0% | −3.17pp |
| ஹைப்ரிட் | 3,640 | 7.1% | 1.3% | −0.31pp |
Every state, December 2025
Registrations by state for December 2025, exact and directly comparable — this is the one state table on the desk that has a real month axis behind it, so the year-on-year column compares the same month a year earlier rather than a part year against a whole one.
| # | மாநிலம் | டிச. 2025 | இந்தியாவின் பங்கு | YoY |
|---|---|---|---|---|
| 1 | மகாராஷ்டிரா | 2,67,800 | 12.5% | +17.4% |
| 2 | உத்தர பிரதேசம் | 2,32,364 | 10.8% | −1.9% |
| 3 | Tamil Nadu | 1,75,676 | 8.2% | +56.6% |
| 4 | குஜராத் | 1,69,526 | 7.9% | +12.8% |
| 5 | மேற்கு வங்காளம் | 1,31,765 | 6.1% | +32.7% |
| 6 | கர்நாடகா | 1,31,453 | 6.1% | +16.7% |
| 7 | மத்தியப் பிரதேசம் | 1,02,925 | 4.8% | +4.4% |
| 8 | ராஜஸ்தான் | 1,00,479 | 4.7% | +11.8% |
| 9 | பீகார் | 93,666 | 4.4% | +17.3% |
| 10 | தெலங்கானா | 93,106 | 4.3% | +22.2% |
| 24 | புதுச்சேரி | 5,658 | 0.3% | +48.7% |
| 25 | திரிபுரா | 5,002 | 0.2% | +5.8% |
| 26 | சண்டிகர் | 4,152 | 0.2% | +17.7% |
| 27 | மணிப்பூர் | 3,778 | 0.2% | +71.4% |
| 28 | அருணாச்சலப் பிரதேசம் | 3,435 | 0.2% | +16.1% |
Chandigarh month by month
The last 15 months on record for Chandigarh. The running month is left without a year-on-year figure.
| மாதம் | பதிவுகள் | YoY |
|---|---|---|
| November 2026 (live) | 3,057 | — |
| அக்டோபர் 2026 | 4,521 | −27.6% |
| செப்டம்பர் 2026 | 4,280 | −0.6% |
| ஆகஸ்ட் 2026 | 4,818 | +22.0% |
| ஜூலை 2026 | 4,747 | +9.5% |
| ஜூன் 2026 | 5,197 | +33.6% |
| மே 2026 | 4,184 | +20.1% |
| ஏப்ரல் 2026 | 4,592 | +18.2% |
| மார்ச் 2026 | 4,946 | +17.2% |
| பிப்ரவரி 2026 | 4,054 | +28.0% |
| ஜனவரி 2026 | 4,827 | +14.1% |
| டிசம்பர் 2025 | 4,152 | +17.7% |
| நவம்பர் 2025 | 5,072 | +42.9% |
| அக்டோபர் 2025 | 6,248 | −9.7% |
| செப்டம்பர் 2025 | 4,307 | +41.6% |
அடிக்கடி கேட்கப்படும் கேள்விகள்
How many vehicles were registered in Chandigarh in December 2025?
Where does Chandigarh rank among Indian states?
What kind of vehicles does Chandigarh buy?
What is the EV share in Chandigarh?
Which manufacturer sells the most in Chandigarh?
இவை சில்லறை விற்பனையா அல்லது தொழிற்சாலை அனுப்பல்களா?
Chandigarh registrations, earlier months
அறிக்கைப் பிரிவிலிருந்து மேலும்
மூலம். ஒவ்வொரு எண்ணும் ஒரு வாகன பதிவு; சாலைப் போக்குவரத்து மற்றும் நெடுஞ்சாலைகள் அமைச்சகத்தின் Vahan 4 டாஷ்போர்டிலிருந்து (vahan.parivahan.gov.in) எடுக்கப்பட்டது — சில்லறை தரவுக்கு FADA மற்றும் தொழில்துறை பயன்படுத்தும் அதே மூலம். பதிவுகள் என்பவை உற்பத்தியாளர்கள் ஒவ்வொரு மாதமும் அறிவிக்கும் மொத்த விநியோக எண்ணிக்கைகள் அல்ல. "EV" என்பது பேட்டரி மின்சார வாகனத்தைக் குறிக்கிறது (Vahan எரிபொருள் வகைகள் PURE EV மற்றும் ELECTRIC(BOV)); ஹைப்ரிட்கள் தனியாக எண்ணப்படுகின்றன. தகவலுக்கு மட்டுமே, முதலீட்டு ஆலோசனை அல்ல.
இந்த எண்களைப் பயன்படுத்துகிறீர்களா? “Flash Finance (Vahan data)” என்பதை இந்தப் பக்கத்தின் இணைப்புடன் மேற்கோள் காட்டுங்கள். இந்த அறிக்கையின் சார்ட் கார்டு அதே வரவுடன் மீண்டும் வெளியிட இலவசம்.